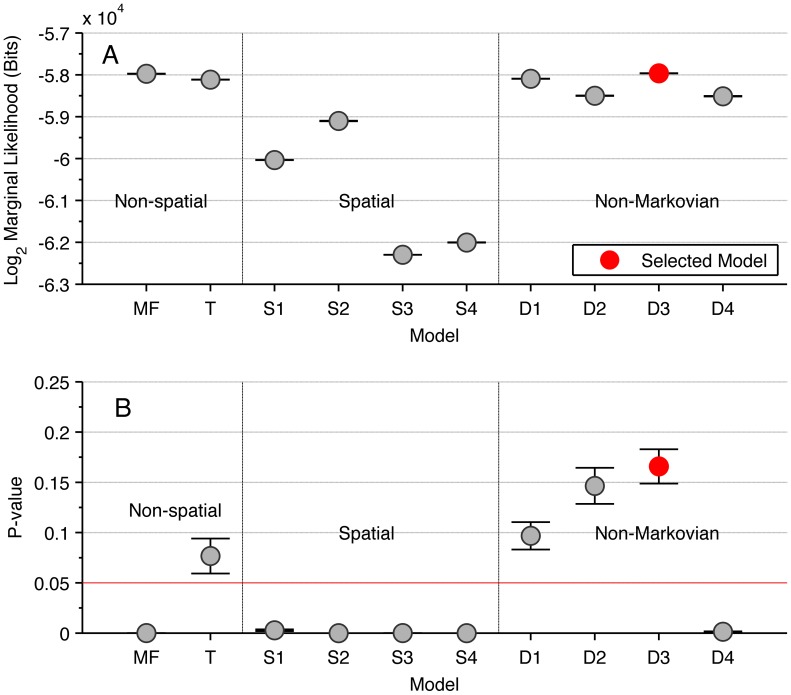
Figure 3. The performance of different models on the fine and large scale.
(A) The marginal-likelihood of each model (excepting the null model), calculated from the fine scale dynamics. Each marginal-likelihood is estimated by annealed importance sampling [47]. (B) The p-value associated with the quality-of-fit test between the distributions of model simulation and experimental outcomes (proportion of prawns travelling clockwise at the conclusion of the trial). Each test is performed on 10 independent sets of 100 simulations. On both measures model D3 is the best-performing model, indicating that the focal prawn interacts with all individuals within a short-range symmetric interaction zone, with a ‘memory’ of these interactions that has a persistent influence on the probability of changing direction. Note that the null model has a lower marginal-likelihood and p-value than all other models and is not shown to preserve the scale of the plot.

