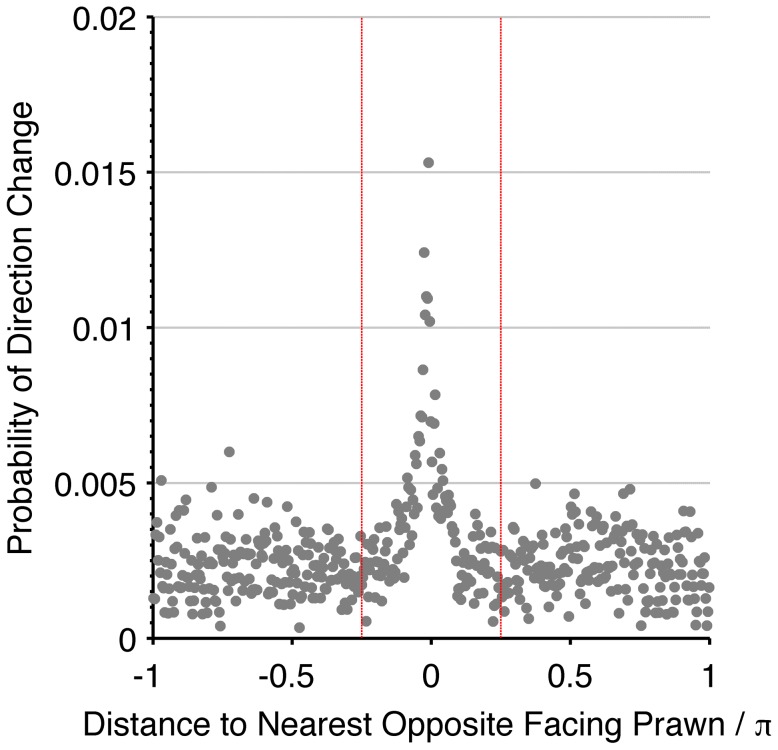
Figure 5. Evidence for short-range interactions.
The empirical frequency of direction changing as a function of the distance to the nearest opposite facing prawn (grey markers). The empirical data clearly shows the spatially localised interaction with a central peak. The red dashed lines indicate a region of  radians, which confines the interaction peak and informs our prior probability distribution on the possible interaction range.

