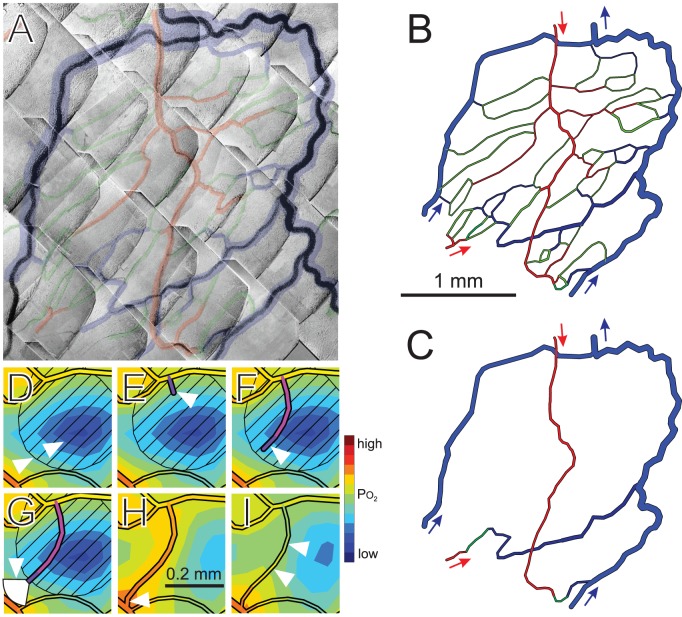
Figure 2. Steps in simulation approach.
(A) Network of microvessels in rat mesentery, imaged using intravital microscopy. Shaded overlay highlights vessel positions, with arterioles (red), capillaries (green) and venules (blue). This region was selected for analysis because the outer loop of venules provides stable boundary conditions for the tissue domain. (B) Computer generated image of network structure, trimmed to reduce the number of network boundary nodes to five (arrows). (C) Network skeleton, used as initial condition for simulations. In (D–I), a small region within a typical simulation is shown at a sequence of times indicating aspects of the method. White triangles denote features mentioned in this caption. (D) The oxygen field surrounding the vessels is computed using the Green's function method. Blue shades denote low oxygen levels. VEGF is assumed to be generated in hypoxic regions and to diffuse according to local gradients, and the resulting VEGF field is computed. Diagonal hatching indicates VEGF concentration above a given threshold. (E) On vessels lying in regions with VEGF above threshold, sprouts are generated with probability dependent on local VEGF concentration. (F) A fixed rate of sprout elongation is assumed. Direction of growth is randomly varied at each time step. (G) If other vessels lie within a sector of radius 100 µm ahead of the sprout tip, the growth is biased towards them. (H) A sprout reaching another vessel forms a connection, allowing flow. (I) Diameters of flowing vessels adapt to metabolic and hemodynamic stimuli.

