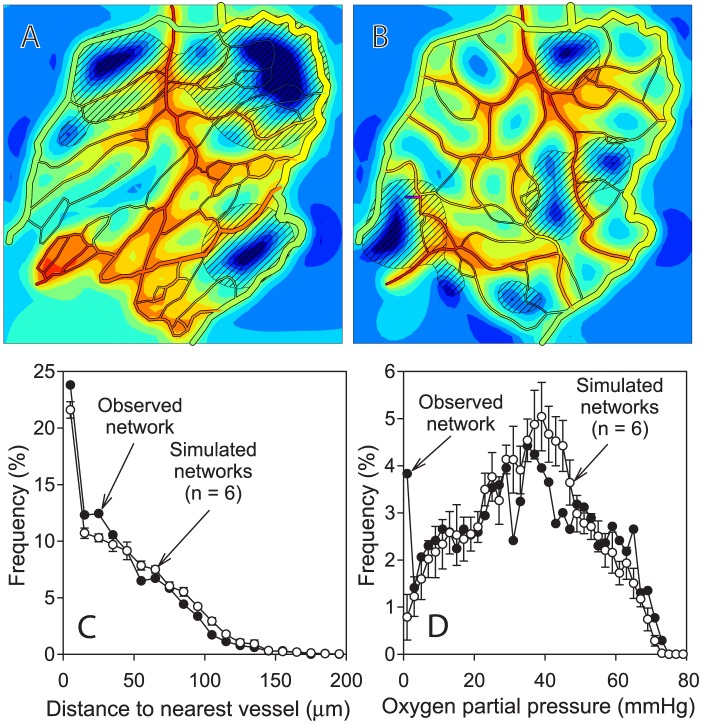
Figure 5. Comparison of simulated and observed network characteristics.
Simulated oxygen and VEGF distributions in experimentally observed network (A), and in simulated angiogenesis at t = 200 days (B). The observed network structure is derived from the image shown in Figure 2A. The network at t = 200 days was derived from the same initial network as shown in Figure 4A but with a different seed for random number generation. Oxygen demand, rate of sprout formation, length scale, color coding of oxygen levels and diagonal shading indicating VEGF above threshold are as in Figure 4. (C) Frequency distribution of distance of tissue points to nearest vessel. (D) Frequency distribution of oxygen levels at tissue points. Results for simulated networks are mean ± standard deviation for n = 6 simulations with different seeds for random number generation.

