
Figure 6. Effect of tension-induced vessel migration on distribution of branching angles.
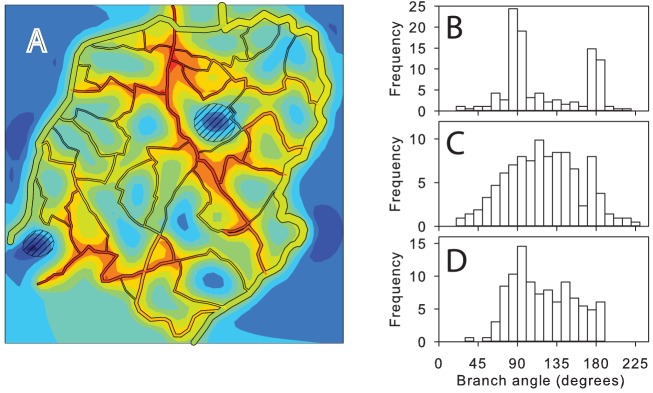
(A) Example of network structure generated when tension-induced migration is suppressed, at t = 200 days. Other conditions are as in Figure 4. (B) Distribution of branching angles for network shown in A. (C) Distribution of branching angles for observed network structure. (D) Distribution of branching angles for network shown in Figure 4 at t = 200 days, including tension-induced migration.