
Figure 7. Dynamics of network generation.
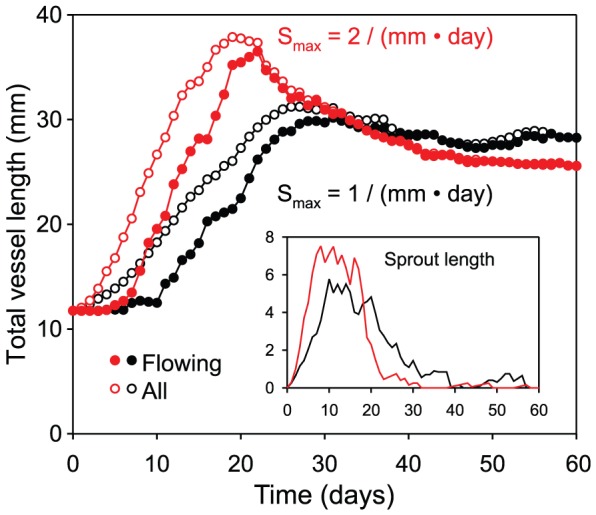
Variation of total vessel length during an individual simulation of angiogenesis. Main plot: vessel length. Inset: length of non-flowing sprouts. Initially, total length increases rapidly due to sprouting. After sprouts form connections, flowing length increases. When sprout formation rate is 2 mm−1day−1 (red curves), summed vessel length shows a strong peak at 20 days and then decreases, stabilizing after 50 days. For reduced sprout formation rate (1 mm−1day−1, black curves), peak vascular length is reduced, stabilization takes longer and total vessel length remains higher.