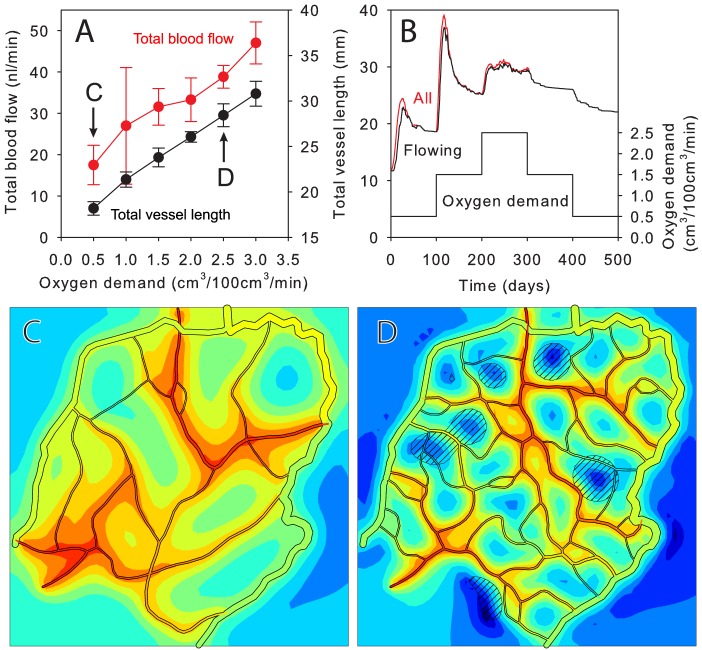
Figure 8. Variation of network properties with oxygen demand.
(A) Total blood flow and vessel length at t = 200 days, for fixed arteriole-venule pressure drop (mean ± s.d. for 6–12 runs). (B) Time-dependent response of total vessel length to step changes in demand. Lower curve: oxygen demand. Upper curves: total vessel length (flowing, all, mean of 3 runs). (C, D) Network structures for demand 0.5 and 2.5 cm3/100 cm3/min. Length and color scales as in Figure 4.

