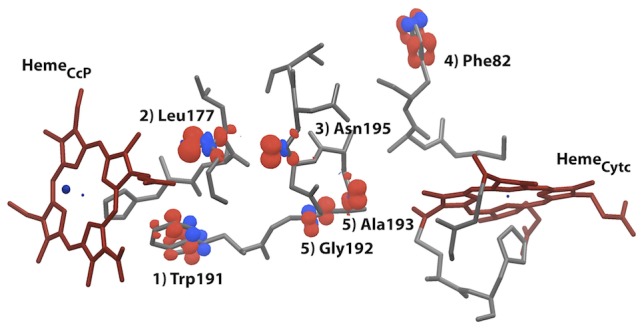
Figure 3. Visual output of the QM/MM e-Pathway method applied on a single MD snapshot.

Molecular orbitals (spin densities of electron hole) are labeled by corresponding residue name and iteration of the approach. I.e. Trp191 being identified first, then excluded from QM region, such that Leu177 is identified second, etc. See methods and SI for details on the QM/MM e-Pathway approach.
