
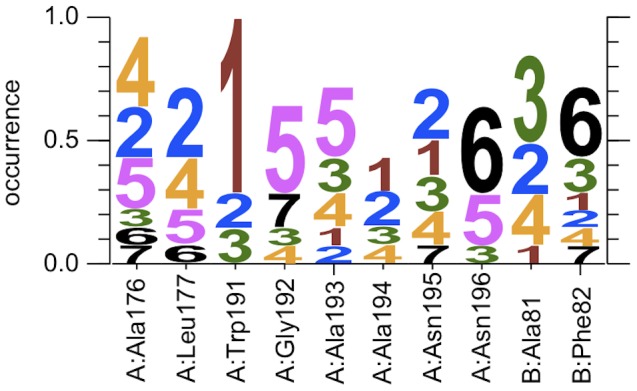
Figure 4. Logo plot summarizing the QM/MM e-Pathway calculations on all 14 snapshots, where the size of a digit d for residue r indicates the relative frequency of residue r being identified as hole acceptor at step d of the iterative approach.
Official websites use .gov
A
.gov website belongs to an official
government organization in the United States.
Secure .gov websites use HTTPS
A lock (
) or https:// means you've safely
connected to the .gov website. Share sensitive
information only on official, secure websites.