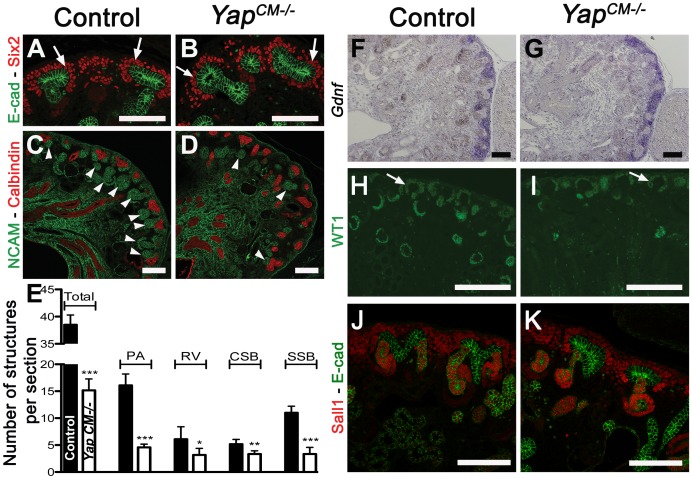
Figure 3. Yap deletion impairs nephron induction, without affecting self-renewal of the CM population.
(A,B) Immunostaining analysis for Six2 (E14.5) shows no change in expression pattern in both genotypes (arrows). E-cadherin was used to visualize the UB compartment. (C,D) Dramatic reduction in nephrogenesis visualized by loss of NCAM-expressing structures (arrowheads) in the nephrogenic zone of Yap mutant compared to wild-type (E16.5). Note the reduced NCAM expression in CM cells. Calbindin highlights the UB and CD. (E) Quantification of early nephron structures in E15.5 controls (black columns) and Yap mutants (white columns) based on NCAM staining. Total***: p<0.0001; PA***: p<0.0001; RV*: p = 0.0209; CSB*: p = 0.0018; SSB***: p<0.0001. (F,G) ISH analysis shows maintained Gdnf expression in CM of control and Yap mutants (E15.5). (H,I) WT1 staining (E18.5) reveals staining in CM cells (arrows) for both genotypes, and dramatic reduction in number of renal MET-derived structures in mutants compared to wild-type. (J,K) Immunostaining analysis for the CM marker Sall1 (E14.5) shows no change in expression pattern in both genotypes. E-cadherin was used to visualize the UB compartment. Scale bars represent 100 µm.

