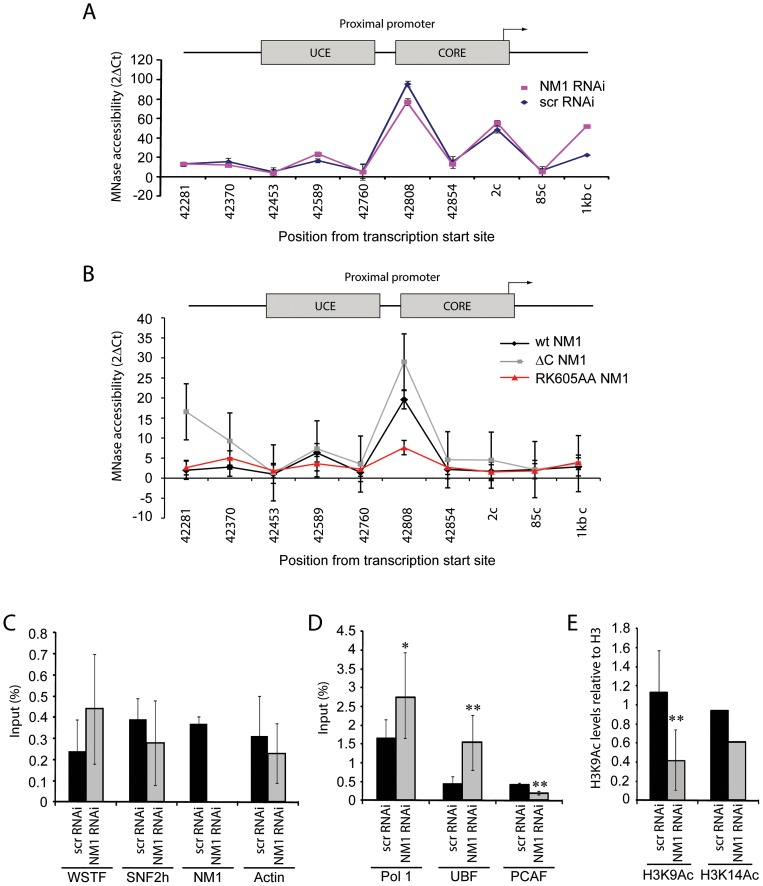
Figure 6. NM1 controls the levels of H3K9 acetylation for the activation of pol I transcription.
(A) Chromatin profile from NM1 knockdown cells (NM1 RNAi, red line) and control cells (Control scrRNAi, blue line) shown as 2ΔCt of undigested and MNase digested cross-linked chromatin. The position of each primer pair used is given below the graph; 2c (coding) denotes Position 2 in the coding region. Error bars represent standard deviations of three separate experiments. (B) Chromatin profile from HEK293T cells stably expressing V5-wtNM1, V5-RK605AA NM1 or V5-ΔC NM1 shown as 2ΔCt of undigested and MNase digested cross-linked chromatin. The position of each primer pair is indicated below the graph; 2c (coding), Position 2 in the coding region. Error bars represent standard deviations of three separate experiments. (C–E) ChIP and qPCR analysis on chromatin isolated from NM1 knockdown cells (NM1 RNAi) and control cells (scrRNAi), (C) using antibody against WSTF, SNF2h, NM1 and actin, (D) antibodies to pol I, UBF or PCAF, and (E) antibodies against histone H3 acetylated on K9 (H3K9Ac) or histone H3 acetylated on K14 (H3K14Ac). In all cases, qPCR analysis was performed with primers amplifying rRNA gene promoters. The values are presented as the percentage of the input signal for each primer pair. Error bars represent standard deviations. Significances [(*), p = 0.05 and (**), p = 0.02] were obtained by Student's T-test, two-sample equal variance.

