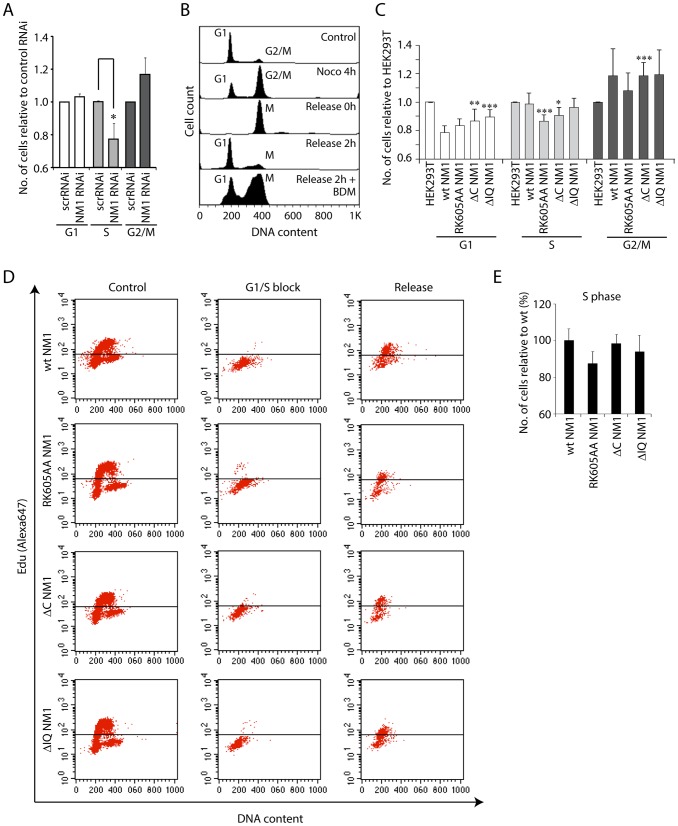
Figure 7. NM1 gene silencing by RNAi leads to a delay in cell cycle progression.
(A) Cell cycle profile measured by flow cytometry on propidium iodide-stained HeLa cells subjected to RNAi-mediated NM1 gene knockdown or control non-specific RNAi (scrRNAi). Standard ratios of G1, S and G2/M phases are shown in relation to scrRNAi. Where indicated, significances (p-values) were calculated by Student's T-test relative to control RNAi. S-phase, p RK605AA = 0.0395 (*). (B) Analysis of cell cycle profile on HeLa cells subjected to BDM treatment. The control unsynchronized population of HeLa cells shows standard ratios of G1 and G2/M phases. Increase of the G2/M cell population is observed after a nocodazole block. Prometaphase cells were harvested by mechanical shock and released from the nocodazole block (0 h), in which case the cell cycle profile exhibits only a mitotic population. Two hours after release from the nocodazole block, appearance of the G1 peak indicates that cells have exited mitosis. However, the presence of 20 mM BDM added immediately after release of the nocodazole block led to delayed cell cycle progression with an increased number of cells in mitosis. (C) Cell cycle profiles for HEK293T cells expressing V5-wtNM1, V5-RK605AA NM1, V5-ΔIQ NM1 and V5-ΔC NM1. DNA staining was done by propidium iodide. Where indicated, significances (p-values) were calculated by Student's T-test relative to HEK293T cells not expressing any of the V5-tagged NM1 constructs. G1 phase, p ΔC NM1 = 0.02 (**), p ΔIQ NM1 = 0.006 (***); S-phase, p RK605AA = 0.0008 (***), p ΔC NM1 = 0.016 (*); G2/M phase, p ΔC NM1 = 0.007 (***). (D–E) Cell cycle profiles obtained by EdU incorporation for HEK293T cells expressing V5-wtNM1, V5-RK605AA NM1,V5-ΔIQ NM1 and V5-ΔC NM1, following synchronization in G1/S phase with aphidicolin. In Panel (E), the numbers of cells in S phase were quantified 2 h after release from the aphidicolin block.

