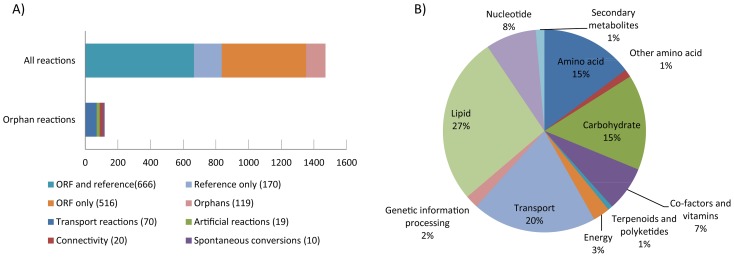
Figure 5. Evidence level for the P. chrysogenum metabolic network.
A) Properties of the reconstructed network. The top bar shows the support for the 1471 unique reactions (not counting exchange reactions) sorted by the type of evidence. The bottom bar shows the orphan reactions; reactions inferred without supporting ORFs or literature references. B) ORF classification. The ORFs in the model are classified into broad groups based on KEGG classification.

