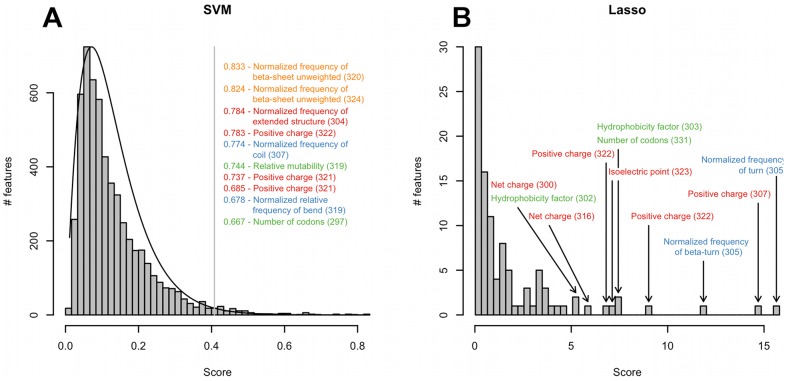
Figure 5. Distribution of scores of features selected using SVM and Lasso.
(A) Distribution of scores of the SVM method. The vertical line indicates the cutoff for the selection of features for the clonal model. The scores of the top-scoring features are listed. (B) Distribution of scores of the Lasso method. Top-scoring features in the distribution are indicated. On both panels, positions of the features mapped on the V3 loop structure are indicated in brackets, labels are colored according to the clusters shown in Figure 4.

