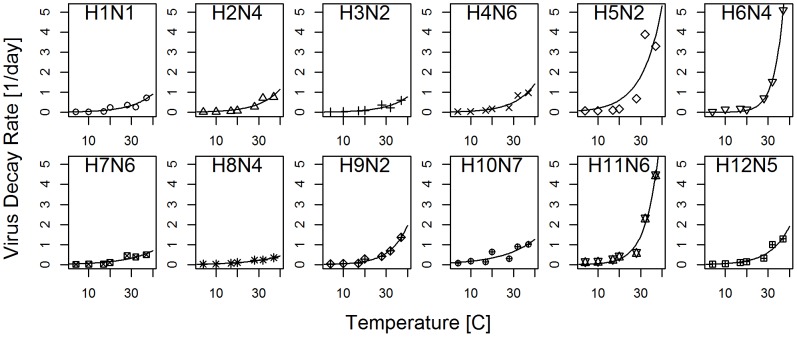
Figure 3. Decay rate for 12 different influenza strains as function of temperature.
Symbols show data, lines show best fit of an exponential function. Virus decay for all strains was measured at the indicated temperature, a pH of 7.2, and salinity of 0. Decay for each strain was measured once for these specific conditions. See [33] for more experimental details.

