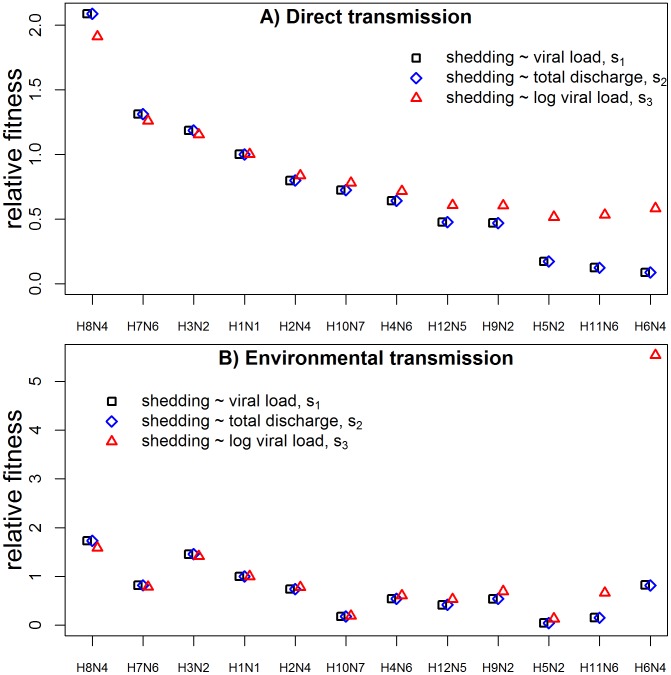
Figure 6. Relative Fitness for the 12 influenza strains.
A) direct transmission (equation 19) and B) environmental transmission (equation 20) scenarios. We plot fitness for the three different link functions,  , between within-host virus load and transmission/shedding described in the model section, i.e.
  ,
,  and
and  given by equations (12), (15) and (16). Strains are sorted according to within-host fitness, with H8N4 having the best within-host fitness (i.e. lowest value of
  , see Table 4). We arbitrarily chose H1N1 as the reference strain, which therefore has a relative fitness of 1.

