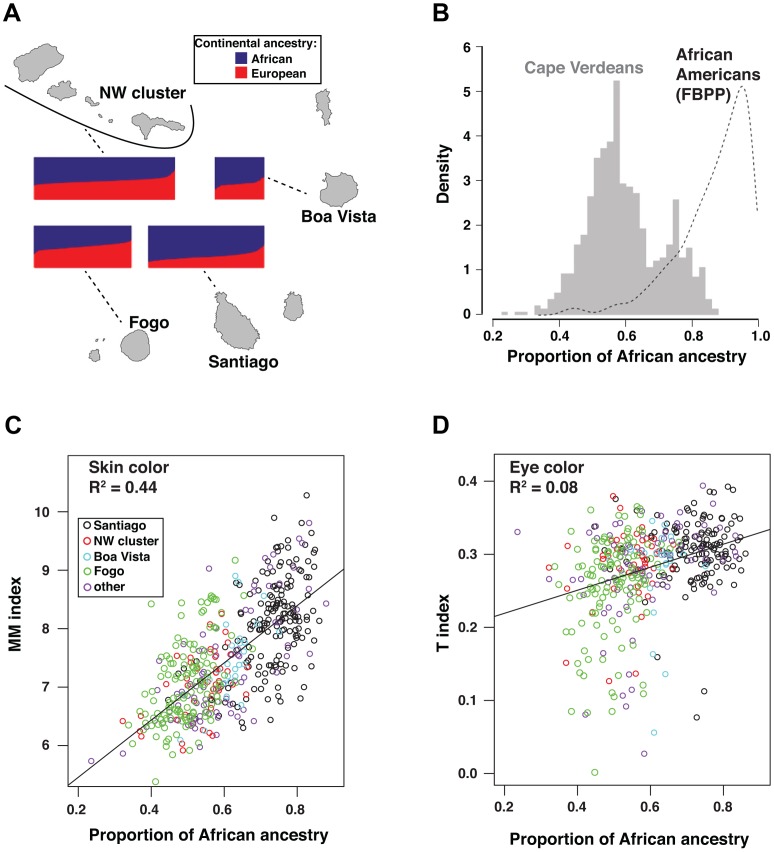
Figure 1. Relationship of geography and ancestry to skin and eye color.
Individual ancestry proportions for Cape Verdeans displayed on all four panels were obtained from a supervised analysis in frappe with K = 2 and HapMap's CEU and YRI fixed as European and African parental populations. (a) Bar plots of individual ancestry proportions for Cape Verdeans across the islands. The width of the plots is proportional to sample size (Santiago, n = 172; Fogo, n = 129; NW cluster, n = 192; Boa Vista, n = 27). The proportion of African vs. European ancestry of the individuals is indicated by the proportion of blue vs. red color in each plot. (b) Individual African ancestry distribution in the total cohort of 685 Cape Verdeans (histogram) and in 802 African Americans (kernel density curve) from the Family Blood Pressure Program (FBPP) [21]. (c) Scatter-plot of skin color vs. Individual African ancestry proportions. Skin color is measured by the MM index described in Material and Methods. (d) Scatter-plot of eye color vs. Individual African ancestry proportions. Eye color is measured by the T-index, described in Figure 2 and Material and Methods. Points in scatter-plots are color coded according to the island of origin of the individuals.

