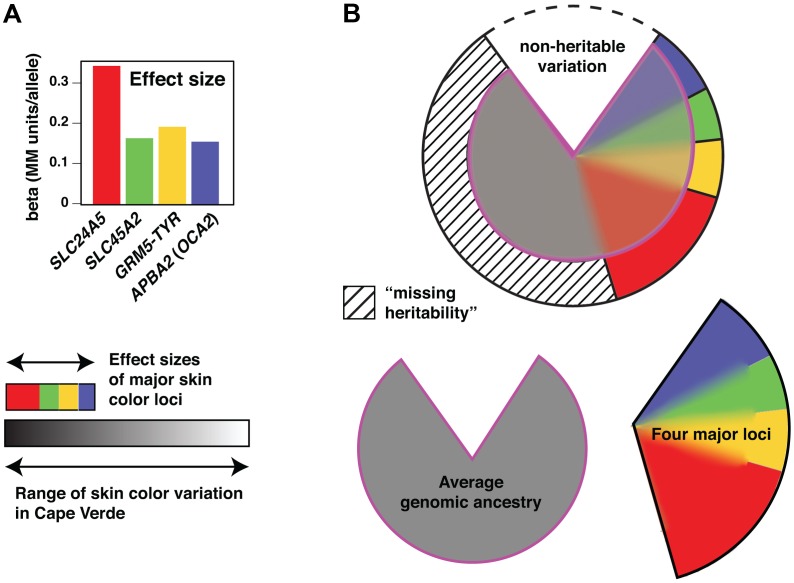
Figure 7. Genetic architecture of skin color variation.
(a) Effect sizes of the loci associated with skin color. Effect values represent the beta values obtained from a regression model containing the four associated loci plus ancestry. (b) The pie chart represents the proportion of phenotypic variation accounted for by the different components, including non-heritable factors (∼20%), the four major loci (∼35%, color-coded as in [a]), and average genomic ancestry (44%). The heritable contributions were estimated by regression and variance decomposition as described in Material and Methods, and are also represented below the pie chart separately as grey (genomic ancestry) or open (four major loci) areas. However, because of admixture stratification, the heritable contributions overlap as described in the text.

