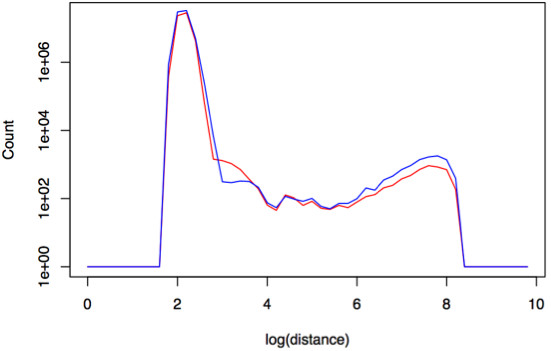
Figure 3.

Example output from Fastbreak showing a density plot of the distances between paired-end read mapped positions. The red line represents cancer samples while blue represents the blood samples from the same patients. Across all the samples, distances between mate pairs of 1000 and 7000 base pairs were found to be more highly prevalent in tumor samples than in corresponding blood samples.
