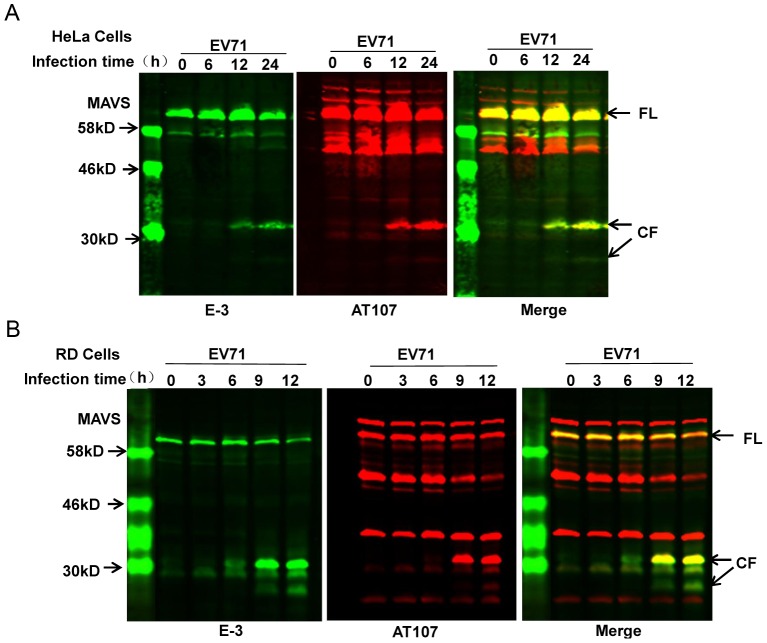
Figure 2. MAVS is cleaved in EV71-infected cells.
Western blot analysis of MAVS expression in EV71-infected (MOI = 10) (A) HeLa cells and (B) RD cells for the indicated time. The time course evaluating MAVS expression was carried out by LI-COR Odyssey Dual-Color System using two different antibodies against MAVS (E-3, 700 nm, green; AT107, 800 nm, red). Results are displayed as images from each channel as well as an overlaid image of the two channels. Arrows indicate full-length MAVS (FL) and the cleaved fragments (CF) derived from MAVS.

