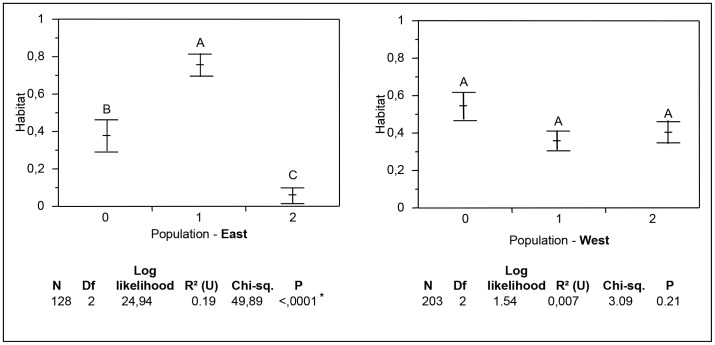
Figure 3. Distribution of Aedes albopictus clusters found with the genetic analysis according to habitat.
Population clusters 0 to 2 have been assigned with Structure software, with cluster 0 being the hybrids between both clusters (with a threshold of 0.70). Chi-square tests were performed to determine the distribution of each cluster according to its habitat. Tukey tests were performed to compare the habitat belonging to each cluster.

