
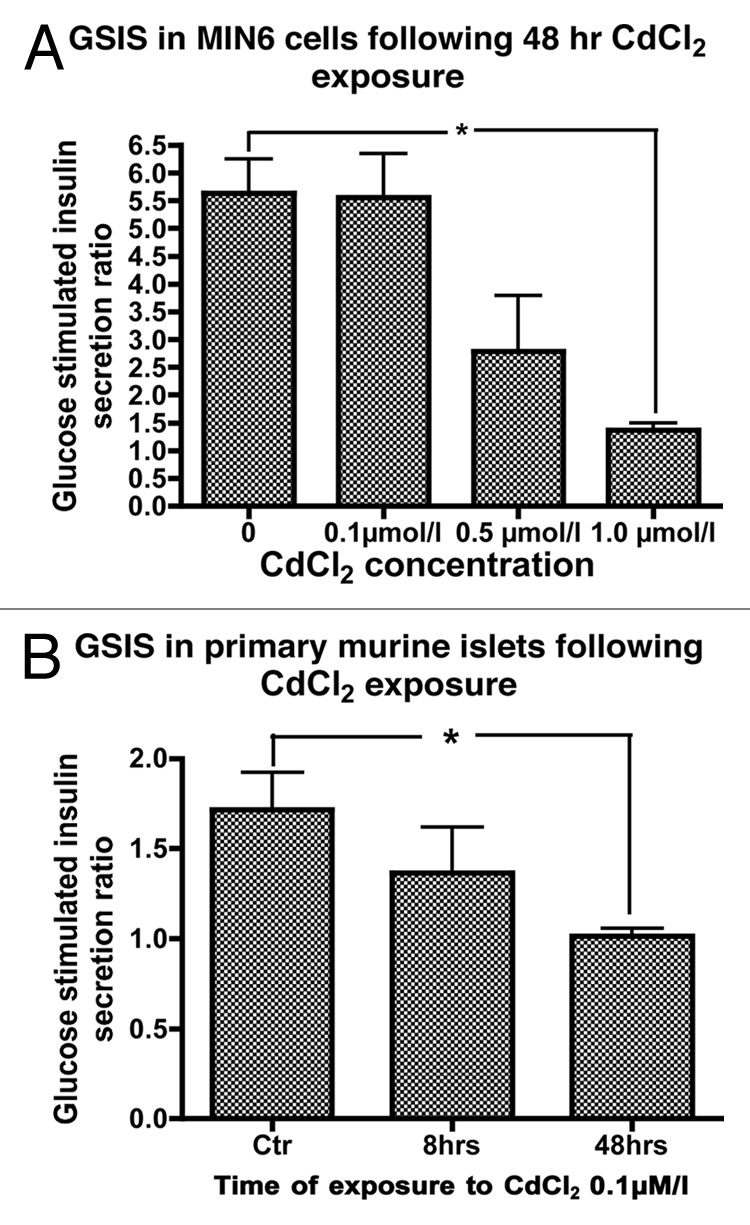
Figure 3. (A) GSIS in MIN6 cells following exposure or not to 0.1, 0.5 or 1.0 µmol/L CdCl2 for 48 h (n = 5, each in duplicate). *, p < 0.05 using Student’s t test with Bonferroni correction. (B) Glucose stimulated insulin secretion (GSIS) in primary mouse islet cells following exposure to 0.1 µmol/L CdCl2 for 8 or 48 h compared with control cells (n = 4, each in duplicate).