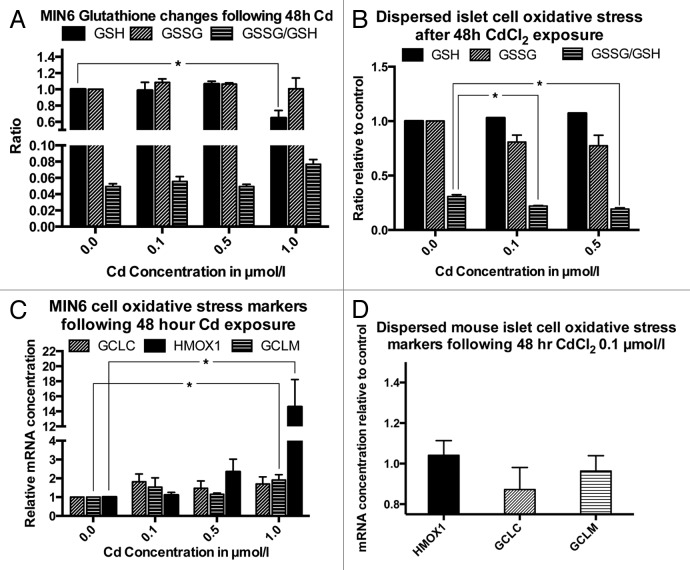
Figure 5. Oxidative stress and oxidative stress markers following exposure to CdCl2 for 48 h: GSH, GSSG (both normalized to the non-exposed control) and GSSG/GSH ratio in MIN6 cells (A, n = 4, each in triplicate) and dispersed primary mouse islet cells (B, n = 3, each in triplicate). mRNA levels of the oxidative response genes GCLC, HMOX1 and GCLM in MIN6 cells (C, n = 4) and in dispersed primary mouse islets (n = 4). *, p < 0.05 using Student’s t-test with Bonferroni correction.

An official website of the United States government
Here's how you know
Official websites use .gov
A
.gov website belongs to an official
government organization in the United States.
Secure .gov websites use HTTPS
A lock (
) or https:// means you've safely
connected to the .gov website. Share sensitive
information only on official, secure websites.
