
Figure 11.
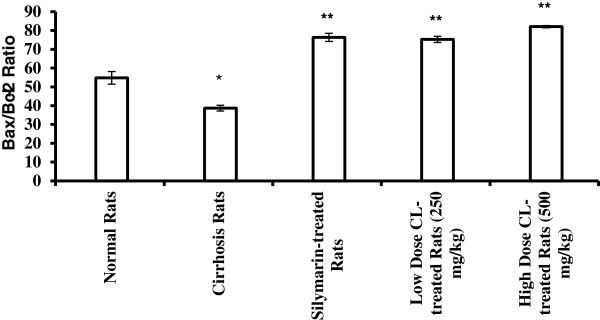
The ratio between pro-apoptotic protein Bax and anti-apoptotic protein Bcl-2. Data were expressed as mean ± SEM. *P<0.01compared with normal control Group 1. **P<0.001 compared with cirrhosis control Group.
Official websites use .gov
A
.gov website belongs to an official
government organization in the United States.
Secure .gov websites use HTTPS
A lock (
) or https:// means you've safely
connected to the .gov website. Share sensitive
information only on official, secure websites.
The ratio between pro-apoptotic protein Bax and anti-apoptotic protein Bcl-2. Data were expressed as mean ± SEM. *P<0.01compared with normal control Group 1. **P<0.001 compared with cirrhosis control Group.