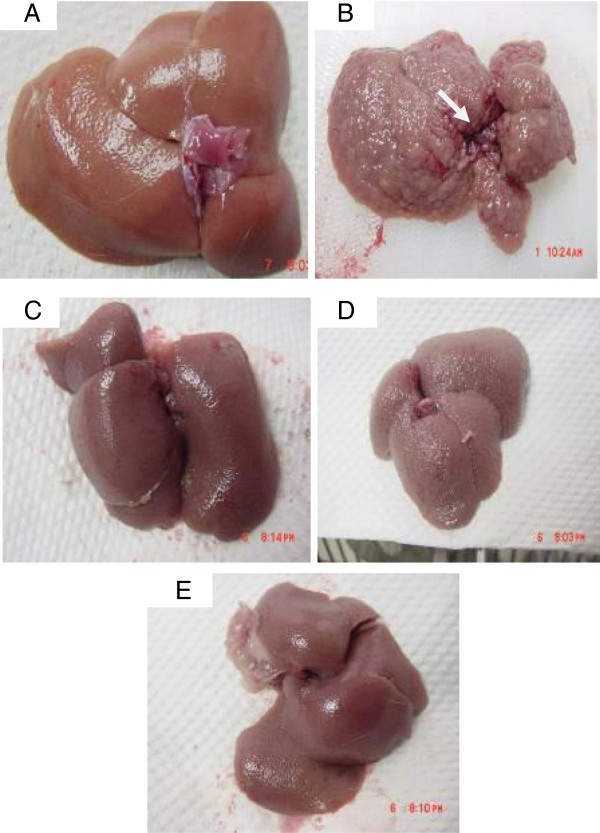
Figure 12.
Representative images showing the macroscopic appearances of livers sampled from rats in different experimental groups. (12A) The liver of a control rat exhibiting a regular smooth surface. (12B) The liver of a hepatotoxic rat depicting numerous irregular whitish micro- and macronodules on its surface and a large area of ductular cholangiocellular proliferation (arrow) embedded within fibrotic areas. (12C) The liver of a hepatoprotected rat treated with Silymarin showing a normal smooth surface. (12D) The liver of a rat treated with low dose CLRE with a nearly smooth surface with few granules (arrow head). (12E) The liver of a rat treated with high dose CLRE with a normal smooth surface.

