
Figure 5.
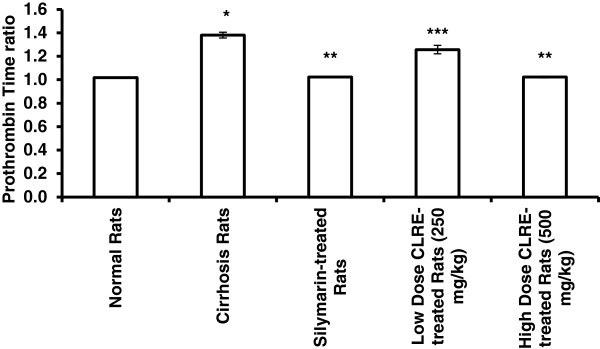
Effect of CLRE on the prothrombin time ratio of rats at the end of 8 weeks study. Data were expressed as mean ± SEM. *P<0.001 compared with the normal control Group 1. **P<0.001 compared with cirrhosis Group 2. ***P<0.01 compared with cirrhosis control Group 2.