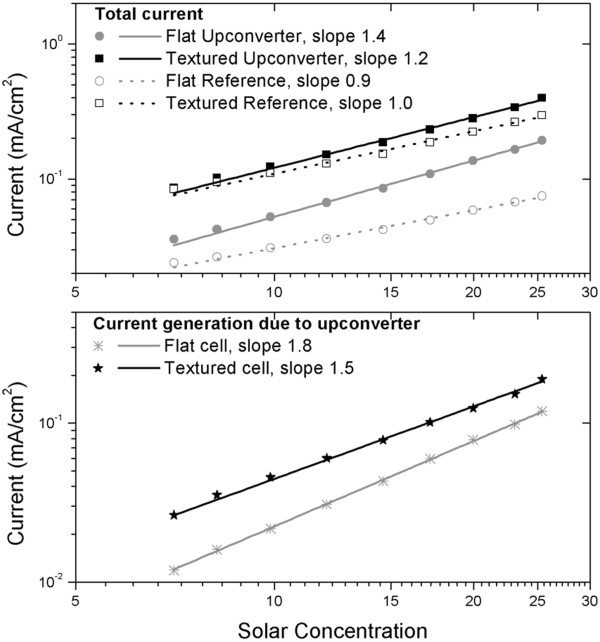
Figure 6.
Current measured in the solar cells under illumination of sub-bandgap light. In the upper graph, the total current of the reference and UC cells are plotted as a function of the concentration factor, while in the lower graph, the current generated by the upconverter is shown. The slope for sub-bandgap response is 1 for flat and textured solar cells. The contribution of the upconverter increases the slope slightly; when corrected for the sub-bandgap response, the slope is 1.5 for the textured solar cells and 1.8 for the flat solar cells.

