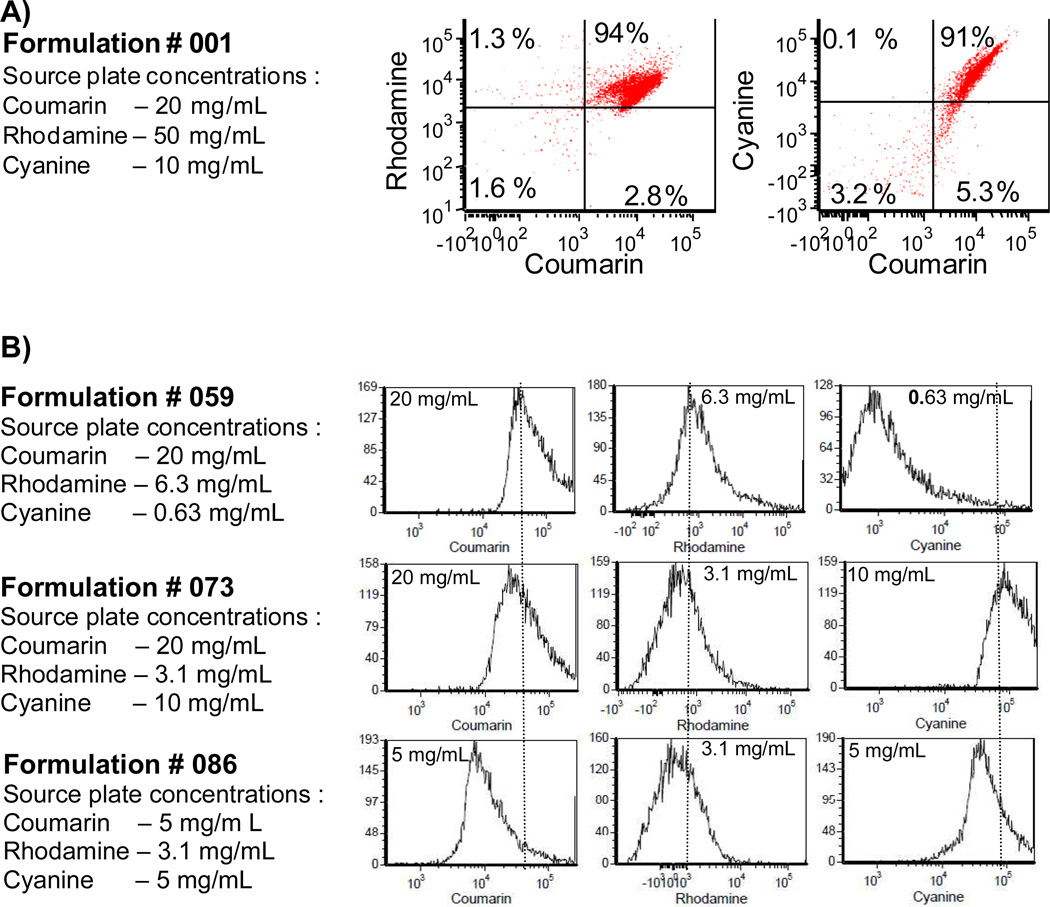
Figure 4.
Particles generated by parallel particle production co-encapsulate fluorescent dyes in a dose-dependent manner. A.) Dot-plot obtained using flow cytometry analysis demonstrates particles are >90% double-positive for each dye, indicating co-encapsulation. B.) Flow cytometry histograms of select particle formulations (see boxes in Fig 3B) demonstrate that dye encapsulation is well-controlled by the source plate concentration. Dotted lines show relative shifts in encapsulated amount.

