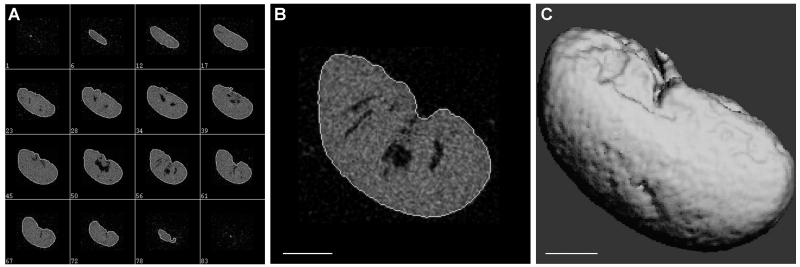
Figure 2. Representative μCT images for a mouse kidney.
(A) Scanning images from adjacent layers showed clear separation of the tissue from the peripheral, and the semi-automatic contouring distinctly outlined the kidney sample. The numbers in the subpanels indicate the serial numbers of sample slices. (B) A representative zoomed in picture for contouring. (C) 3D reconstruction of the kidney image from the scanned layers used for the computation of the total kidney volume. Scale bar = 1 mm.

