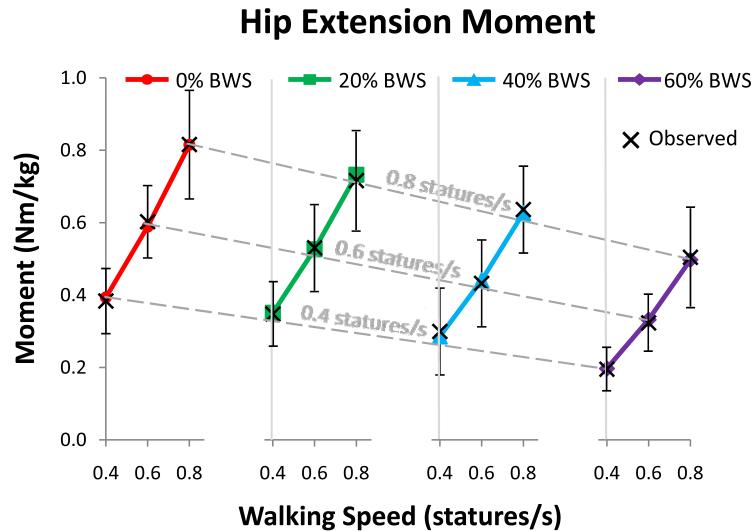
Figure 6.
Predicted and observed average peak hip extension moment as it changes with walking speed (varied from 0.4 to 0.8 statures/s) and BWS level (varied from 0% to 60% bodyweight). The values predicted by the linear regression models (Table 1) are shown by the filled shapes and the observed values are shown by “X”s, with error bars on the observed values indicating ± 1 standard deviation. Walking speed sensitivity at each BWS level was calculated as the slope of each solid line. BWS sensitivity at each walking speed was calculated as the slope of each dashed line (due to the even spacing between the four BWS plots). There was a significant interaction effect between walking speed and BWS level, so the slopes of the solid and dotted lines change with these variables.

