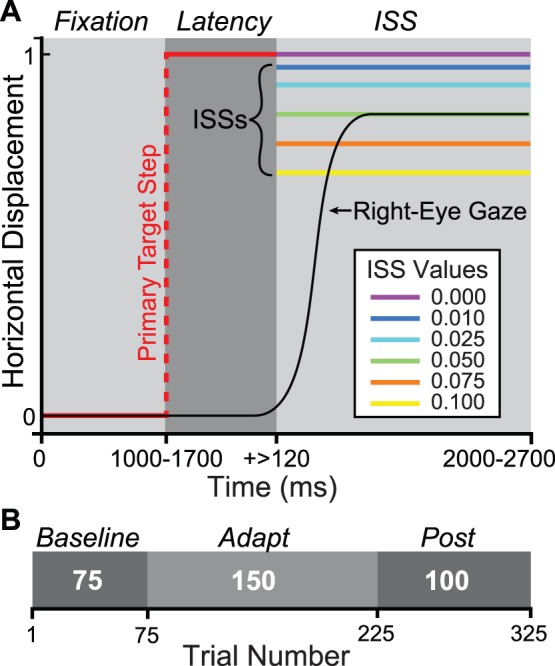
Figure 1. Methods.

A. Single-Trial Temporal & Spatial Structure. Red: pre-saccade target; black: right-eye gaze; violet: 0.0 (no) ISS; blue: 0.01; light blue: 0.025; green: 0.05; orange: 0.075; yellow: 0.1. ISSs and primary target step are not drawn to scale. Gray scale boxes and italic text above indicate trial temporal windows. Fixation: pre-target-step fixation period; Latency: delay (ms) between primary target step and primary saccade onset; ISS: intrasaccadic target step and subsequent corrective saccade period. B. Experimental session phase structure. Phases are depicted as gray scale boxes with phase names above (italic). White numerals in each box indicate phase-length in trials. Absolute trial number is indicated on the axis.
