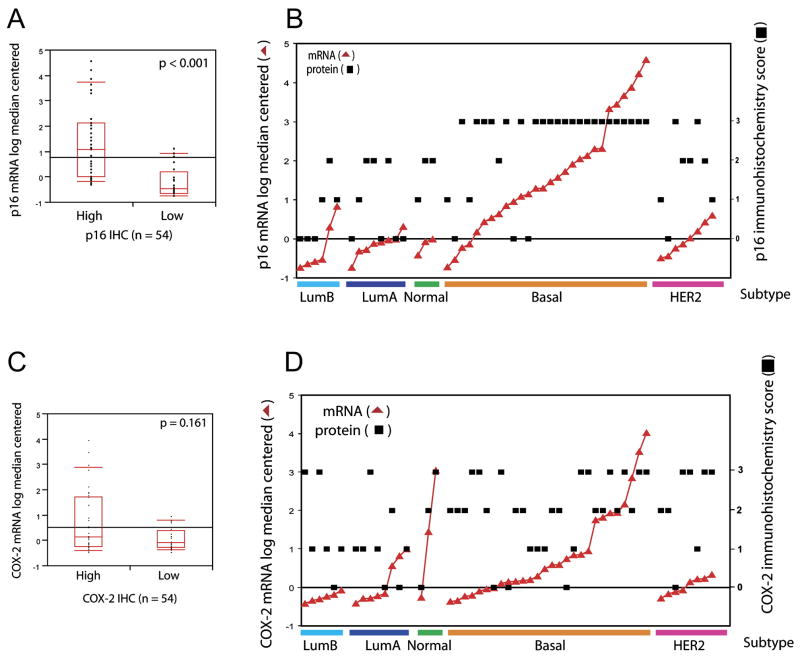
Figure 4. Concordance between p16 or COX-2 mRNA and protein expression in tumors.
A) p16 mRNA and protein levels show concordance using Wilcoxon rank of sums test.
B) p16 mRNA and protein concordance across molecular tumor subtypes. The log median centered mRNA level of p16 is plotted (red triangles) in comparison with the corresponding protein levels (black squares).
C) COX-2 mRNA and protein levels demonstrate poor concordance using Wilcoxon rank of sums test.
D) Discordance between COX-2 mRNA and protein levels is enriched in HER2 positive tumors. The mRNA level of COX-2 for each sample is plotted (red triangles) in comparison with corresponding protein levels (black squares).

