Fig. 2.

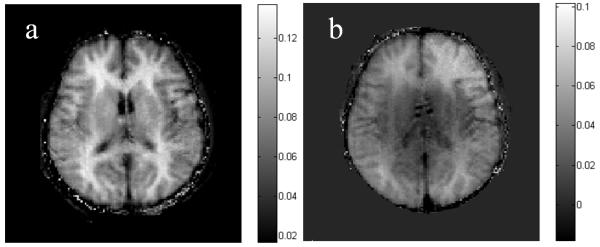
MT asymmetry maps calculated by subtracting the MT images of 3.5 ppm from –3.5 ppm. a: At B1 = 0.9 μT. The WM is brighter than the GM. b: At B1 = 2.3 μT. The WM-GM contrast is weaker.

MT asymmetry maps calculated by subtracting the MT images of 3.5 ppm from –3.5 ppm. a: At B1 = 0.9 μT. The WM is brighter than the GM. b: At B1 = 2.3 μT. The WM-GM contrast is weaker.