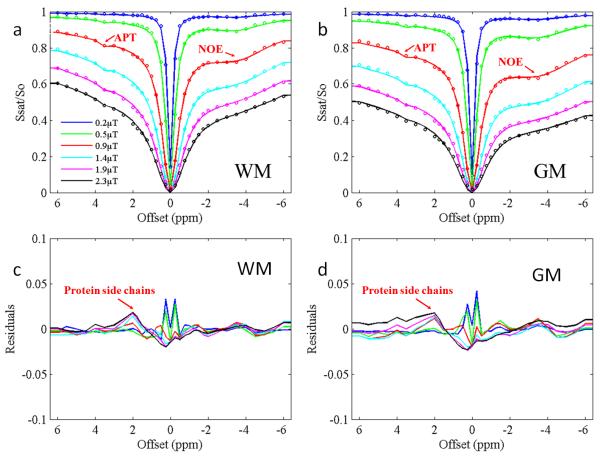
Fig. 3.
Fitted results of a typical volunteer using a four-pool model. a: Fitted results of the WM. b: Fitted results of the GM. c: Fitted residuals of the WM. d: Fitted residuals of the GM. Experimental data are shown as dots and fitted plots are shown as lines. R-square is in a range of 0.9893 - 0.9990.

