
Fig. 6.
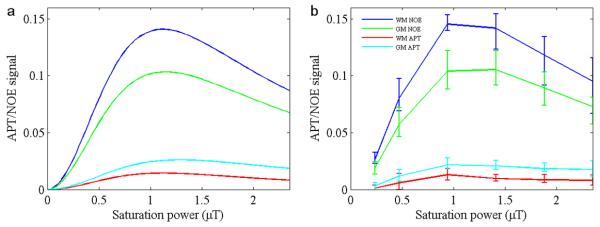
Simulated (a) and experimental (b) signals from NOE and APT, as a function of B1 for Experiment 1. Simulated results (a) were obtained based on the subtraction of the four-pool model from the three-pool simulation. Experimental results (b) were obtained based on the subtraction of experimental data (n=5) from the three-pool simulation. Error bars indicate SD. Both APT and NOE signals peak around 1 - 1.4 μT.