
Figure 5. Analysis of tRNAGlu and tetrapyrrole levels in sig2 and sig6 mutants.
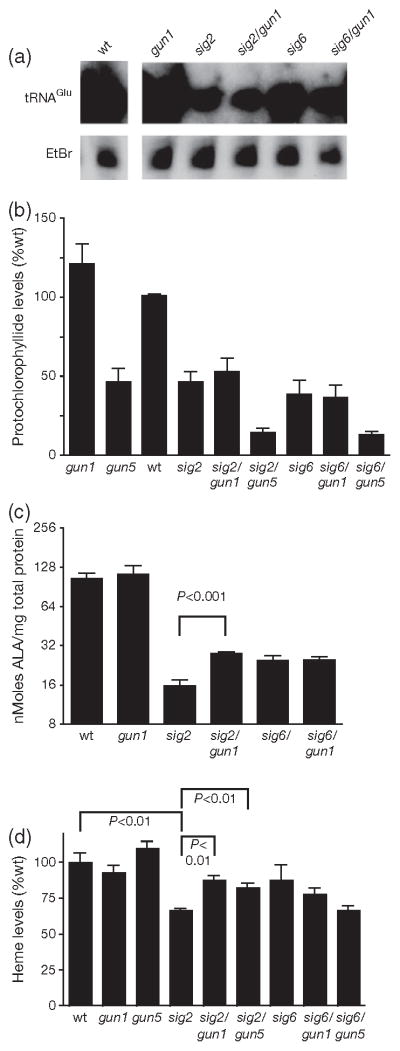
(a) Northern blot analysis of tRNAGlu; (b) steady-state levels of Pchlide; (c) ALA biosynthetic capacity; and (d) steady-state levels of non-covalently bound heme in 2-day-old seedlings. Error bars indicate the mean ± standard error of the mean (SEM) of two independent experiments with biological duplicates.