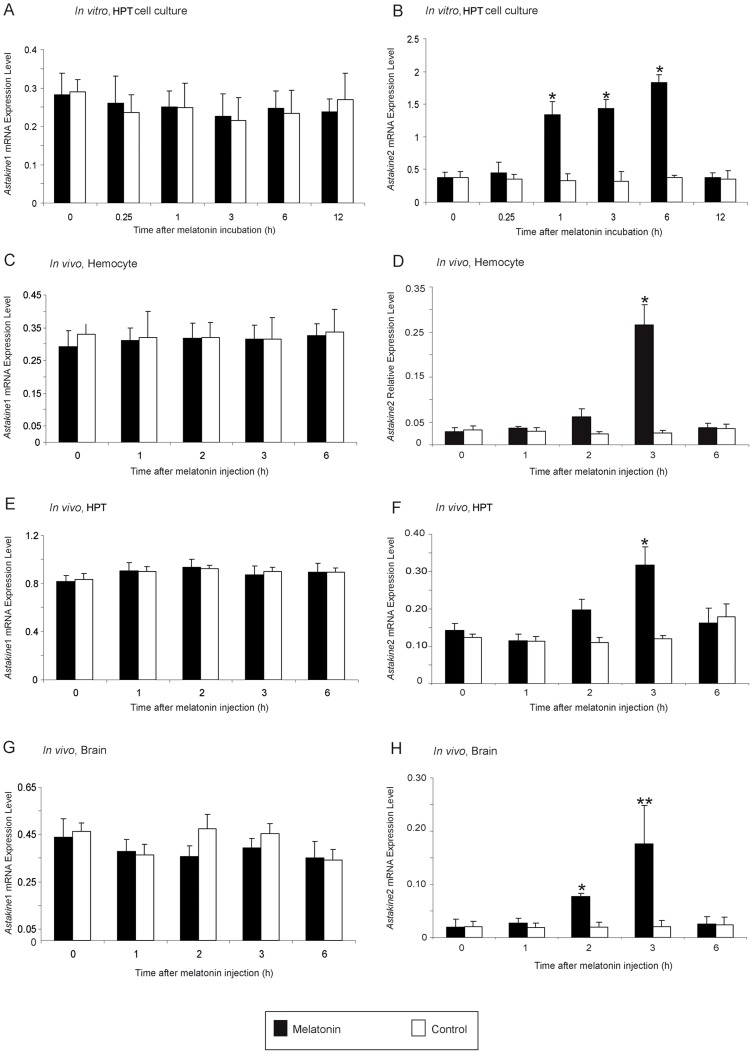
Figure 1. AST2 expression is induced by melatonin treatment in vitro and in vivo.
A) Relative expression of AST1 mRNA estimated by qPCR, after incubation with melatonin in cultured HPT cells in vitro at daytime. Black bars = melatonin (3 µM), white bars = control. B) Relative expression of AST2 mRNA estimated by qPCR, after incubation with melatonin in cultured HPT cells in vitro at daytime. Black bars = melatonin (3 µM), white bars = control. C) Relative expression of AST1 mRNA in hemocytes estimated by qPCR, after injection of melatonin in live crayfish. Black bars = melatonin (4.3 nmol/g), white bars = control. D) Relative expression of AST2 mRNA in hemocytes estimated by qPCR, after injection of melatonin in live crayfish at daytime. Black bars = melatonin (4.3 nmol/g), white bars = control. E) Relative expression of AST1 mRNA in HPT estimated by qPCR, after injection of melatonin in live crayfish at daytime. Black bars = melatonin (4.3 nmol/g), white bars = control. F) Relative expression of AST2 mRNA in HPT estimated by qPCR, after injection of melatonin in live crayfish at daytime. Black bars = melatonin (4.3 nmol/g), white bars = control. G) Relative expression of AST1 mRNA in the brain estimated by qPCR, after injection of melatonin in live crayfish at daytime. Black bars = melatonin (4.3 nmol/g), white bars = control. H) Relative expression of AST2 mRNA in the brain estimated by qPCR, after injection of melatonin in live crayfish at daytime. Black bars = melatonin (4.3 nmol/g), white bars = control. Expression of the 40S ribosomal protein was used as an internal control. Error bars indicate standard deviation (SD) from three replicates and the experiment has been repeated three times with similar results. The asterisks indicate significant differences (*P<0.05, **P<0.01); one-way ANOVA with Duncan's new multiple-range test and the Tukey test.

