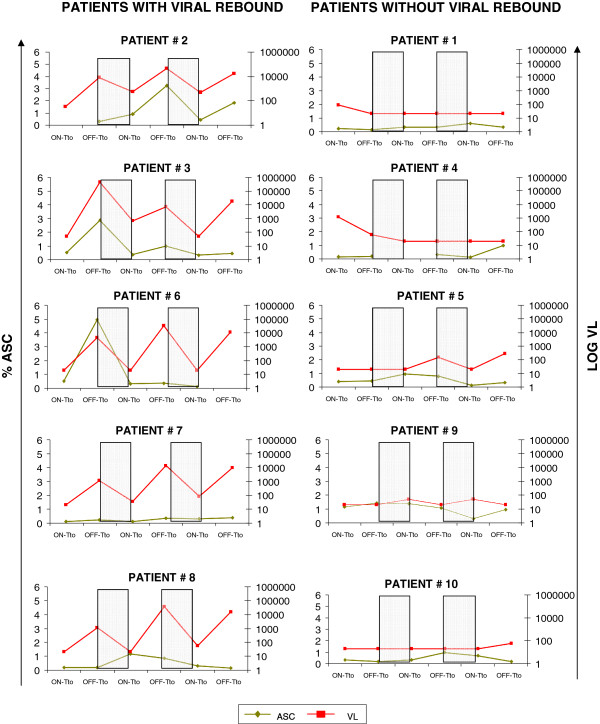
Figure 1.
The frequency of ASC was increased after treatment interruption. ASC frequency (measured as % of ASC) and viral load (measured as Log10HIV-1RNAcopies/ml) dynamics along the study period for the five patients with viral rebound (left panels) and the five patients without viral rebound (right panels), after treatment interruption are shown. The on-treatment samples correspond to the time of stopping treatment in each STI, whereas the off-treatment sample correspond to the moment of treatment re-start after the correspondent STI. Intervals when subjects were on therapy are shaded.

