Figure 1.
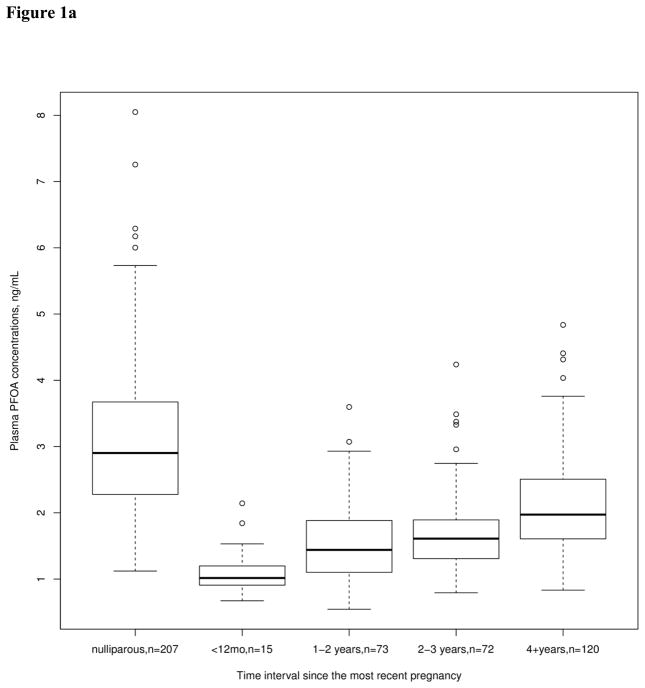
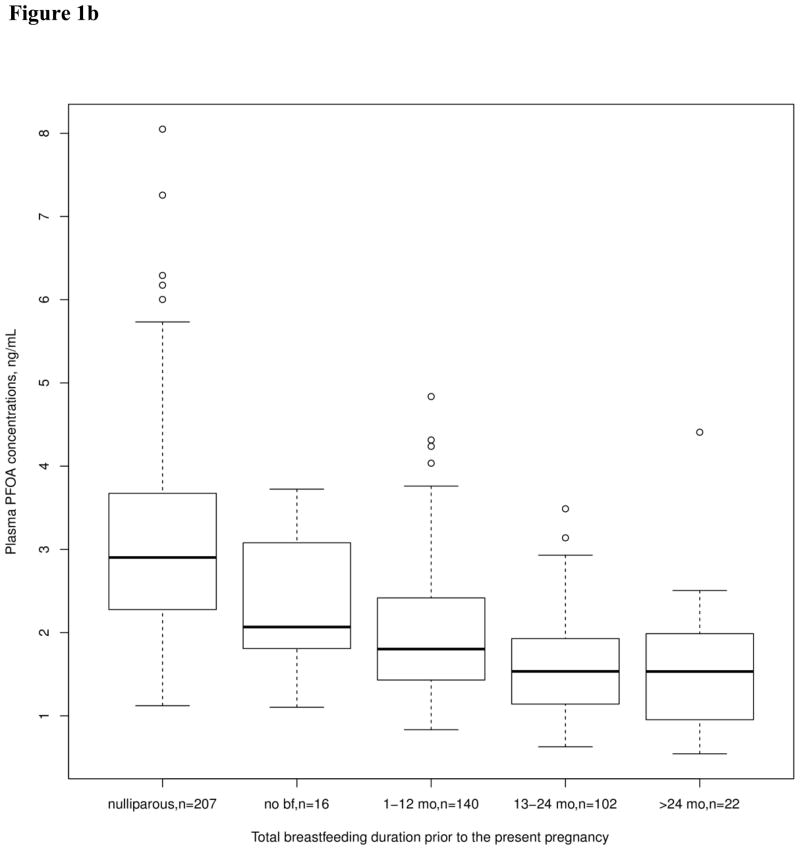
Unadjusted plasma PFOA concentration (ng/mL) by categories representing time intervals since the most recent pregnancy (Figure 1a) and by categories representing total breastfeeding duration (Figure 1b). Box plot details: the horizontal lines indicate the median PFOA concentration; the box indicates the interquartile range (IQR) (25th percentile to 75th percentile); the whiskers represent observations within 1.5 times the IQR; and the circles indicate observations more than 1.5 times the IQR away from the box, considered outliers.


