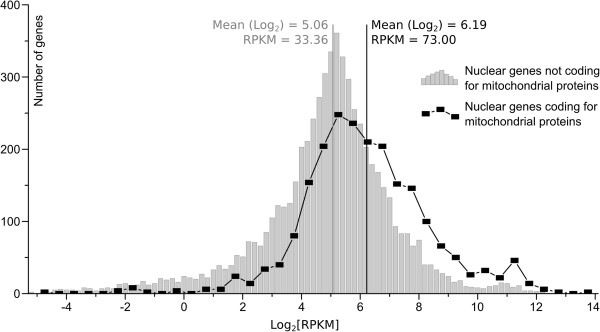
Figure 3.

The distribution of RPKM values (in log2 scale) in mitochondrial (black line) and non-mitochondrial (gray histogram) genes. The transcription of the mitochondrial genes was 2.18 x higher (on average) than that of the non-mitochondrial genes.
