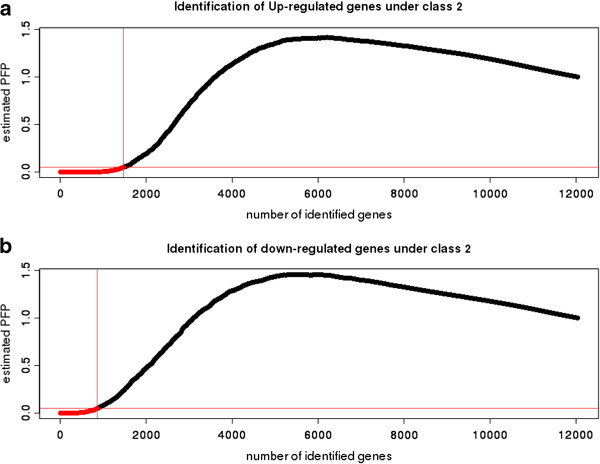
Figure 2.

Differential gene expression in the TCGA ovarian dataset. Affymetrix TCGA gene expression dataset in ovarian tumor samples (class 1) vs. normal samples (class 2): A. Up-regulated genes and B. Down-regulated genes. RankProd analysis of differential gene expression at a percentage of false prediction (pfp) ≤ 5% is shown.
