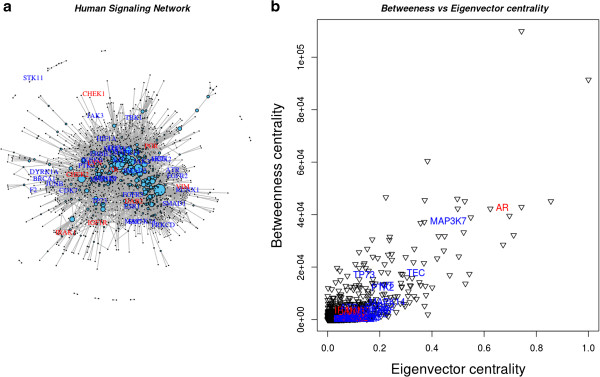
Figure 5.

Differentially and non-differentially expressed genes with high Boolean scores mapped to the human signalling network. A. Mapping of differentially expressed (with red labels) and non-differentially expressed (with blue labels) expressed genes from the TCGA data set on the human signalling network. Node size represents the residual value of linearly regressed betweenness and eigenvector centralities. B. Betweenness vs. eigenvector centrality plot of nine differentially expressed and 32 and non-differentially expressed genes identified in the human signalling network.
