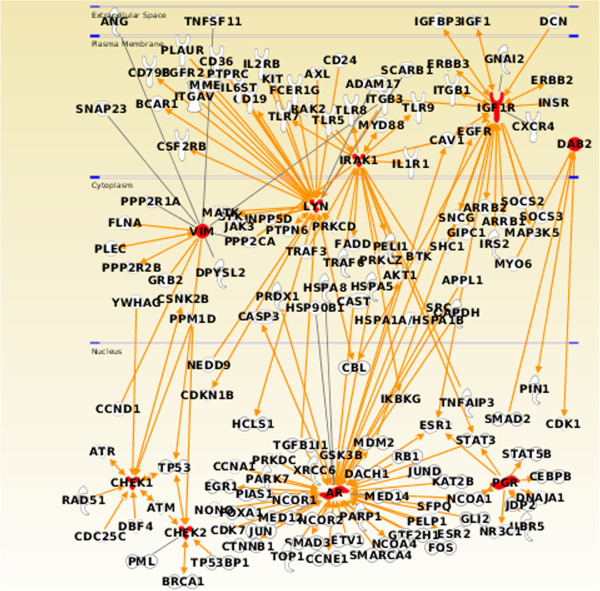
Figure 6.

Ingenuity Pathway Analysis visualization of oncogene interactions. Interaction of nine differentially expressed genes with high Boolean scores in the human signalling network mapped to known oncogenes in the Ingenuity Pathway Analysis knowledge-based expert system.
