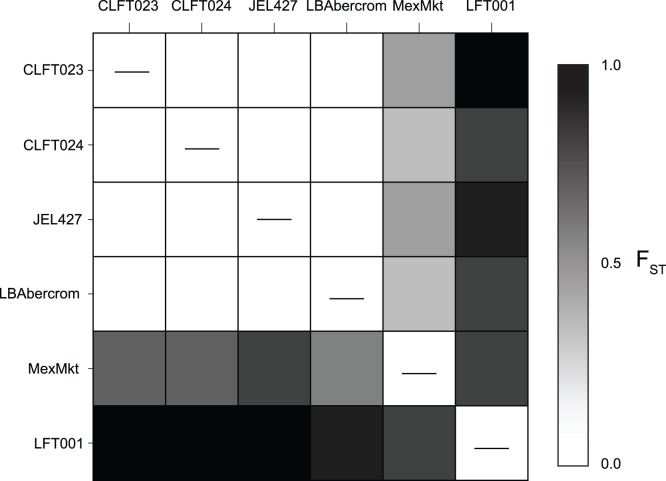
Figure 6. Pairwise F ST values based on ITS1 haplotype frequencies in each Bd strain.
Upper and lower diagonals are pairwise F ST values estimated from ITS1 haplotypes obtained by cloning/Sanger sequencing, and from Illumina sequencing, respectively. Darker shades represent greater genetic differentiation.

