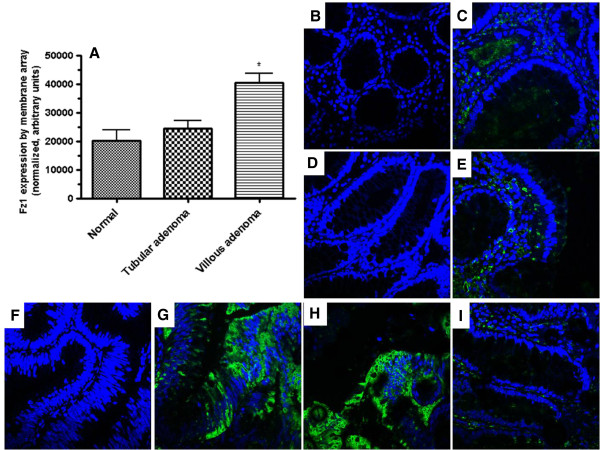
Figure 3.
Expression of Fz1 in colonic adenomas. Panel A: mRNA levels by Wnt specific membrane array in normal colonic mucosa, tubular adenoma and villous adenomas (N=12). p=0.0176 (1 way ANOVA) with p<0.05 by Newman-Kuels post hoc analysis for villous vs. normal and villous vs. tubular; p=0.024 villous vs. tubular (unpaired Student’s t test); p=0.012 villous vs. normal (unpaired Student’s t test). Panel B, C: Normal colonic mucosa – secondary antibody only (B) and merged images (C) - showing lack of Fz1 expression. Both panels co-stained with DAPI. Panel D, E: Tubular adenoma – secondary antibody only (D) and merged images (E) - showing lack of Fz1 expression. Both panels co-stained with DAPI. Panel F, G, H: Villous adenomas – secondary antibody only (F) and 2 merged images (G, H) of villous adenomas from different patients. Staining with anti-Fz1 (G, H) antibody demonstratesFz1 expression. All panels co-stained with DAPI. Panel I: Merged image of normal colonic mucosa adjacent to villous adenoma showing lack of Fz1 expression.

