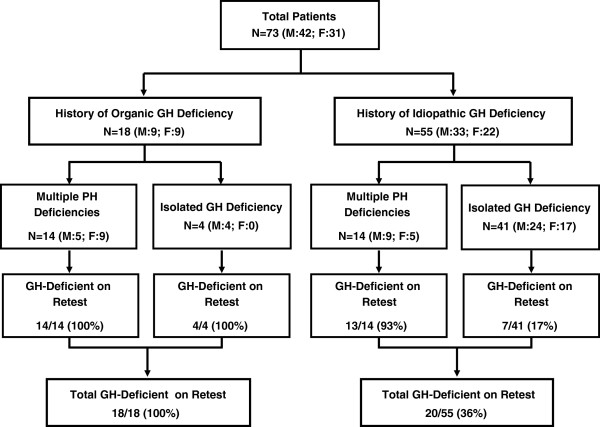
Figure 1.
Participant flow diagram. Participant flow diagram of patients included in this study, showing numbers with history of organic vs. idiopathic GH deficiency, multiple pituitary hormone deficiencies vs. isolated GH deficiency, and numbers with confirmed GH deficiency on retesting. F = female; GH = growth hormone; M = male; N = number of patients; PH = pituitary hormone.

