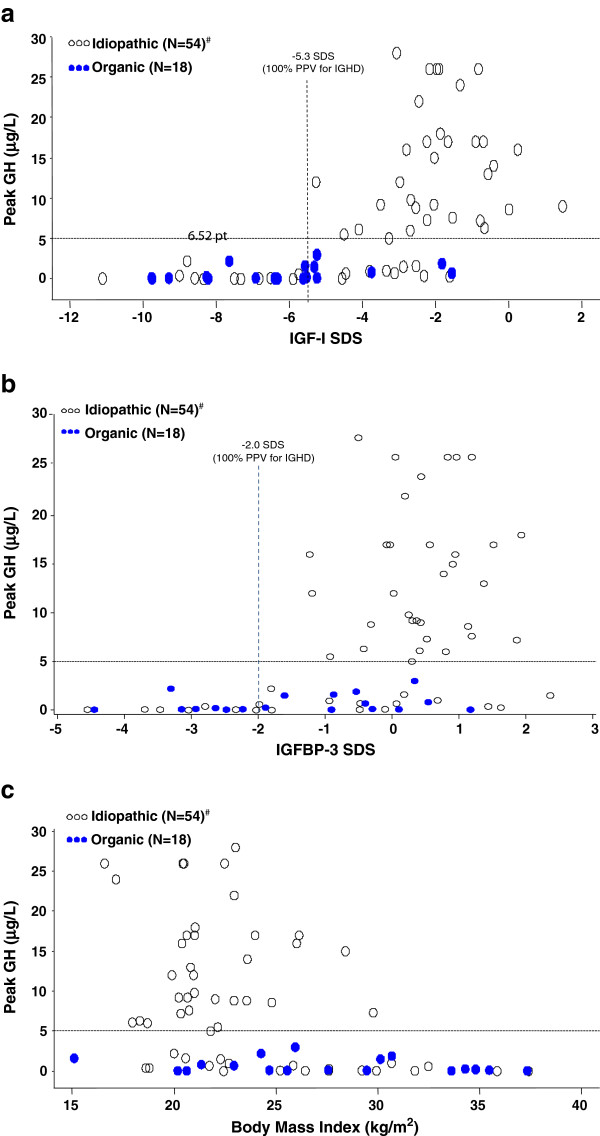
Figure 3.
a. Relationship between IGF-I SDS and peak GH response. Dashed vertical line represents the IGF-I threshold of -5.3 SDS, which provides 100% PPV for the diagnosis of persistent GH deficiency in patients with IGHD. IGF-I = insulin-like growth factor –I; b. Relationship between IGFBP-3 SDS and peak GH response. Dashed vertical line represents the IGFBP-3 threshold of -2.0 SDS, which provides 100% PPV for the diagnosis of persistent GH deficiency in patients with IGHD. IGFBP-3 = insulin-like growth factor binding protein 3; c. Relationship between body mass index and peak GH response. For the idiopathic group, Spearman r = -0.39, p = 0.003. There was no significant correlation for the organic group. Notes and abbreviations: See “Results” for listing of stimulation tests used; #One outlier idiopathic patient with a peak GH of 57 μg/L was excluded to avoid undue influence on the correlation and compressing the vertical axis. GH = growth hormone; IGHD = idiopathic GH deficiency; N = total number of patients in each category (organic vs. idiopathic); PPV = positive predictive value; SDS = standard deviation score.

