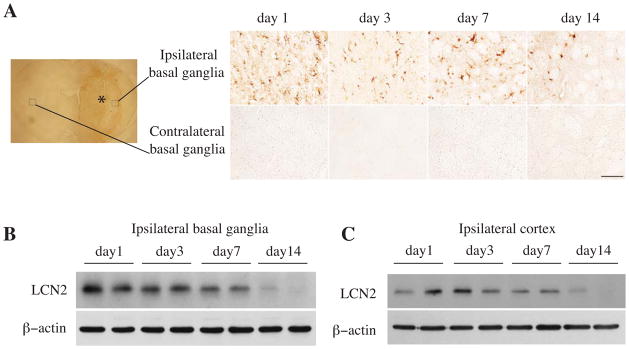
Figure 1.

Time course showing LCN2 immunoreactivity in the ipsi- and contralateral basal ganglia (A), and the protein levels of LCN2 and β-actin in the ipsilateral basal ganglia (B) and cortex (C) after an injection of 100μl autoglous blood into the right caudate. The asterisk indicates the hematoma, the boxes indicate the locations where higher powered immunohistochemistry images were taken. Scale bar=100 μm.
