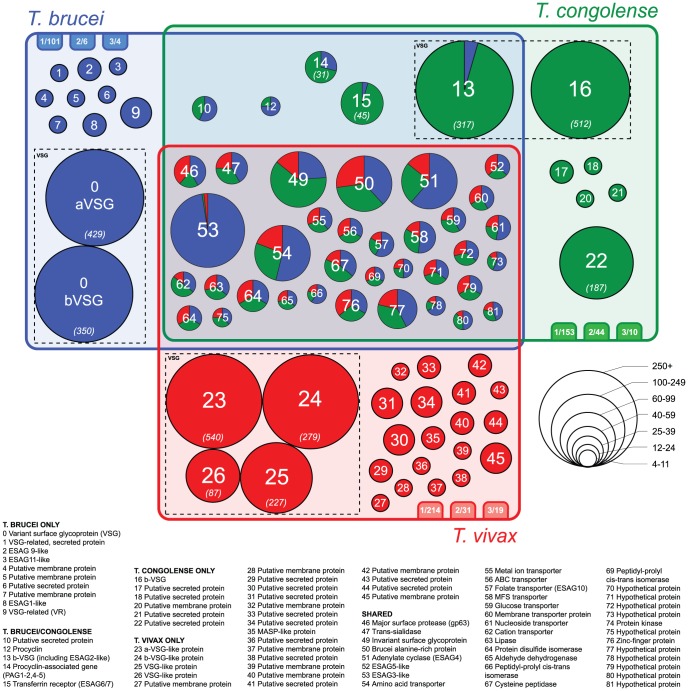
Figure 1. The taxonomic distribution of gene families in the cell-surface phylome, displayed in a Venn diagram.
Phylogenies for all families are available through GeneDB. Each circle represents a family (i.e. >3 gene copies). The label in each circle refers to the description key, while size reflects the number of genes it contains; for large families the absolute number is shown in parentheses. For families present in multiple species, a pie chart is shown indicating relative gene numbers. The three tabs attending each species domain show the number of single-copy genes, pairs and triplets also predicted to have cell surface roles and to be species-specific (e.g. 101 singletons in T. brucei).

