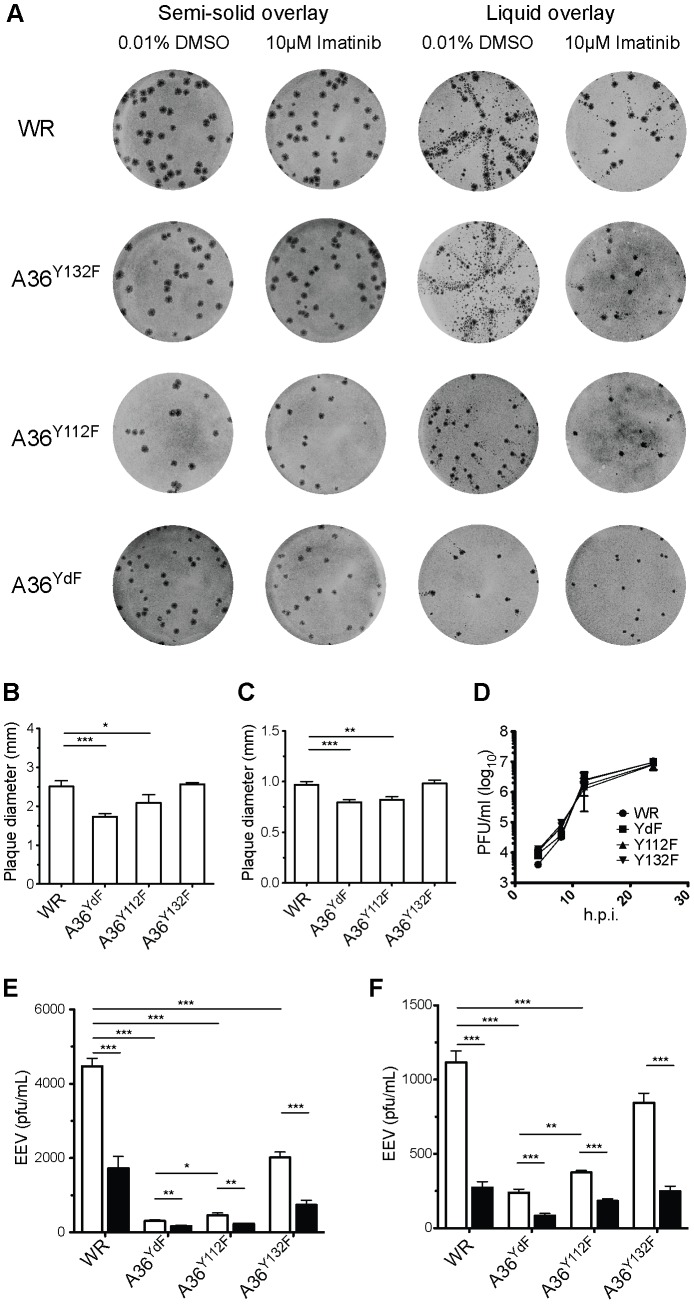
Figure 1. Plaque size and release of VACV is inhibited by mutation of Y112 and Y132 residues in A36.
(A) BSC-1 cells were infected with the indicated viruses, incubated with a semi-solid (plaque assay, 1.5% CMC) or liquid (comet assay, DMEM) overlay, with either imatinib or carrier (DMSO), stained at 72 hpi. (B) Average plaque size of WR, A36Y112F, A36Y132F and A36YdF in BSC-1 or (C) NIH 3T3 cells. Error bars represent s.e.m. from 50 plaques. (D) Single-step growth analysis of VACV strains. Monolayers of BSC-1 cells were infected with the indicated viruses at a MOI of 5. At 4, 8, 12 and 24 hpi cells and supernatants were harvested and virus titres were determined by titration with BSC-1s. The average titres of two independent experiments are plotted at each time point. (E) Levels of infectious EEV in supernatants collected 16 hpi from BSC-1 cells or (F) NIH3T3 cells infected at an MOI of 0.1 and overlayed with DMEM containing 0.01% DMSO (unfilled) or 10 µM imatinib (filled). Error bars represent s.e.m. from 3 replicate wells in 3 independent experiments. P values of <0.05, <0.01 and <0.001 are represented by *, ** and ***, respectively.

